Every pull request to our bidder runs a load test before it is allowed to merge. If the slow end of the latency curve gets worse, or errors climb, the build fails and the change does not ship. We have had that gate for months. Recently we sat down and read one of its reports properly — and found it had been measuring something other than what we assumed.
This is what the harness does, what we got wrong about it, and what the platform actually handles.
Why a load test blocks the merge
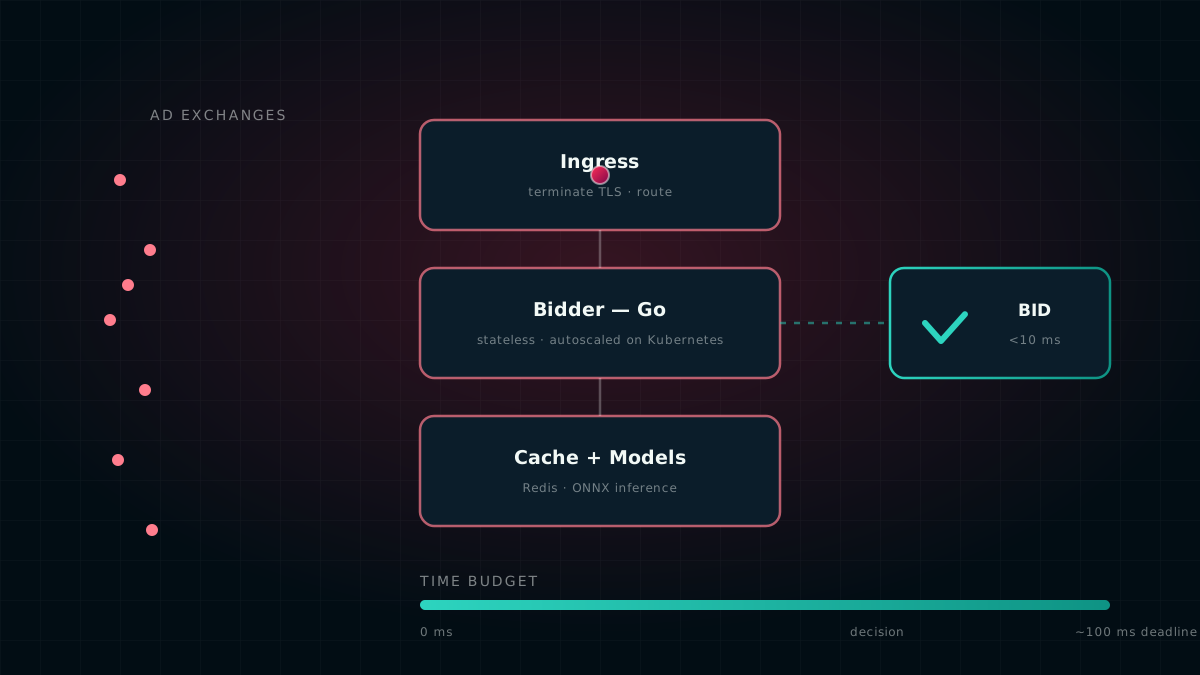
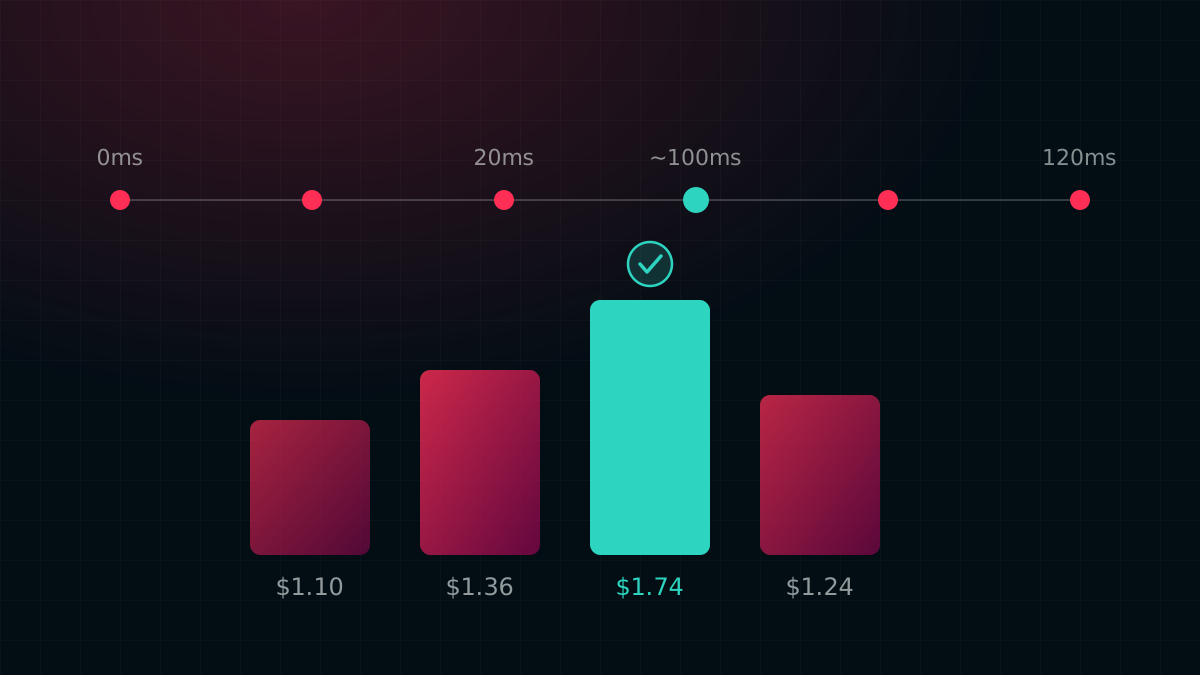
A bidder has one hard promise: answer before the auction closes. An exchange gives you roughly a tenth of a second, and a late answer is the same as no answer — you simply lose the impression.
That makes slowness a correctness problem, not a comfort problem. And slowness usually arrives quietly: a new lookup, an extra allocation, a lock held slightly too long. None of it breaks a unit test. So we put a load test in front of the merge button, where it can stop the change before it reaches production instead of after.
What the harness actually does
It generates synthetic OpenRTB bid requests and fires them at a real bidder instance, then reports what came back.
- Realistic requests, not toy ones. Banner, video, native and connected TV, in a realistic mix. Standard IAB banner sizes, real VAST protocol versions, a device split between in-app and web, a spread of countries. Fake traffic that looks nothing like real traffic tells you nothing.
- Repeatable runs. Every run takes a seed. Same seed, same traffic — so when a number moves you are comparing like with like, and you can replay the exact run that failed.
- A deliberate mess option. A chaos setting makes a share of requests malformed on purpose: missing fields, wrong types, impossible values, truncated JSON. The bidder should reject those cleanly. If it returns a server error or hangs instead, that is a bug, and we would rather find it here.
- A pass or fail, not a wall of text. The run exits non-zero if the slow tail or the error rate crosses the thresholds we set. That is what makes it a gate rather than a report nobody reads.
- It fills the dashboards too. The same traffic flows through the event pipeline into analytics, so the reporting side has real rows to render.
What our own test was hiding
Here is the part worth writing down.
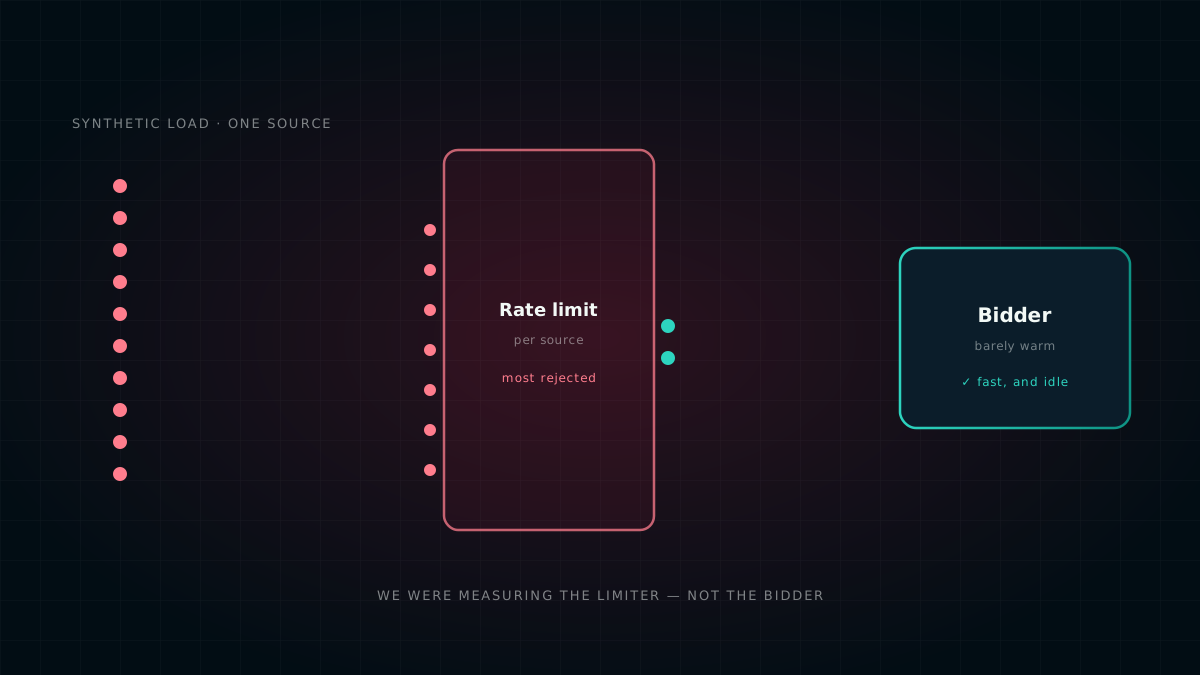
The load generator drives traffic hard from one source. The bidder, quite correctly, has a rate limit that caps how much any single source can send — that is basic protection for anything facing the public internet.
So most of the traffic in the run never reached the bidding logic at all. It hit the limiter and came back as a rejection, exactly as designed. The latency numbers in the report were real, but they described the requests that got through, which were a small fraction of what we sent.
Read properly, the run proved two useful things: the rate limiter works under pressure, and the requests that are served are served fast. It did not prove the third thing we had been assuming — that the platform can absorb that volume of real bidding work. That was never in the data.
Read the status codes before you read the latency. A load test whose traffic is mostly being rejected is a test of your rejection path. It can look perfect — fast responses, zero errors, green build — while telling you nothing at all about capacity. "Offered" and "served" are two different numbers, and only one of them is throughput.
What we changed
- The report leads with the status mix. Successes, rejections and errors, side by side at the top. If rejections dominate, that is the headline of the run, not a footnote below the percentiles.
- Capacity is measured where capacity lives. Real traffic arrives from many sources, so per-source limits never bind the way they do for a single generator. Production, with its own instrumentation, is the honest place to read throughput — a single-source generator answers a different question.
- The gate keeps its real job. It is a regression detector for the served path and a robustness check under malformed input. That is genuinely valuable. We just stopped asking it a question it was never answering.
What the platform actually handles
So here are the real numbers, read from our own production monitoring over the 24 hours to 3 September 2026 — the same dashboards our engineers look at, not a lab result. They describe that window, and nothing after it.
- Close to ten million ad requests that day. That averaged a few hundred every second, and in that window the busiest five minutes stayed under 400 a second.
- No server errors at all in that window. Not a low rate — none.
- The bidder scales itself with the traffic. It holds no state between requests, so scaling it is just a matter of running more copies; an autoscaler adds and removes them as the day moves, between a floor and a ceiling we set.
And the part that actually matters, the latency in that same window, measured against the deadline an exchange gives us:
Bid latency over the 24 hours to 3 September 2026. A snapshot of that day, not a service level — see the note on numbers below.
Read that honestly. In that window, half of all bid requests were answered in under about 20 milliseconds, and ninety-nine in a hundred inside 90 — under the deadline, but not by a comfortable margin. That last bar is the one we work on, and it is the reason the gate exists: the slow tail is where a bidder quietly starts losing auctions long before anything looks broken. It is also the number that moves the most as traffic grows, which is exactly why we date it.
An earlier version of our architecture post described this capacity as millions of requests per hour. That was wrong — it is millions per day — and it came from reading the load-test report the way described above. We have corrected that page. Publishing a number you cannot pull from a dashboard is exactly the habit this post is arguing against, so it would be poor form to quietly fix it and say nothing.
What we took away
- A green build is not evidence. A passing test tells you the thresholds were not crossed. It does not tell you the test was asking the right question.
- Check what your traffic actually did before you read how fast it was. Latency computed over a small surviving fraction is a real number about an unrepresentative sample.
- Measure the claim you intend to make. If you want to say "we handle X", the measurement has to be of X — under conditions where X is actually possible.
- Publish numbers you can re-run. Every figure above can be pulled from a dashboard on demand. That is the test we now apply before anything goes on this site.
- Keep the test that is doing its real job. Ours was never useless — it was mislabelled in our heads. Those are different problems with different fixes.
If you want the wider picture of how the pieces fit, that is the architecture post. For another case of a test that passed while covering a real bug, there is the jitter postmortem.
Production figures above were read from our own monitoring across the 24 hours to 3 September 2026, rounded deliberately. They are a dated snapshot of what the platform did in that window — not a guaranteed service level and not a promise about any other day. Traffic and latency both move, and later measurements will differ; the p99 in particular tracks how much traffic is arriving. We give rounded figures rather than exact ones on purpose. We also leave out the specifics of our rate limits, thresholds and configuration — describing that a limiter exists is useful to readers; publishing where it sits is only useful to someone testing it. No client, partner or per-advertiser data appears here.