An impression is a thing that happened. A person is a claim. Every ad report turns the first into the second with a number called reach, and most platforms do not say how. Here is how ours does it: which impressions can be turned into people at all, how the rest are estimated, where the estimate comes from, and how the report tells you which is which.
Reach is a count of people, so it is never a sum
A person who saw your campaign on Monday, Wednesday and Friday is one person, not three. So reach for a date range cannot be the daily figures added together; it has to be counted once, over the whole range, in one pass. That sounds obvious, and we got it wrong ourselves: until 9 October 2026 the “Unique Users” card on our Reach & Frequency report summed the daily rows, so returning readers were counted once per day and the average frequency read low by the same factor. It is fixed, and we say so here because a report you cannot question is not worth much.
The same rule applies to every breakdown. A table of creatives, sites or placements gets a total that is one count over the whole table, never the rows added up. If the rows do not add up to the total, that is correct — the same person can appear in two rows.
Who can be counted at all
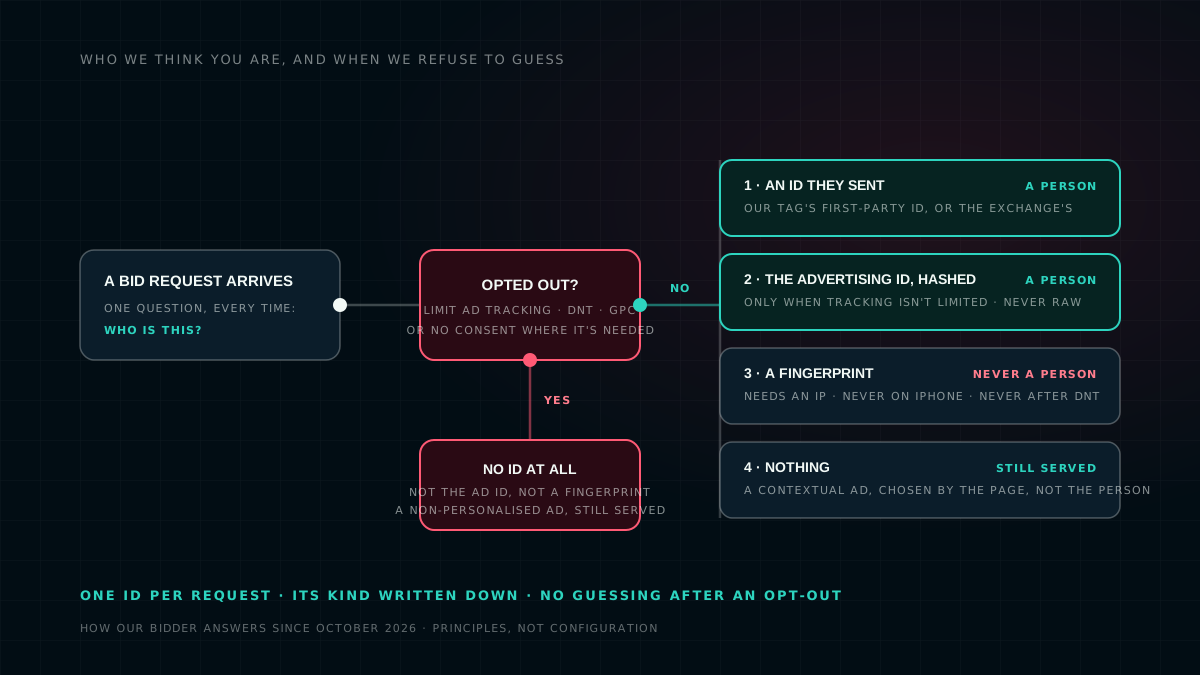
Only an impression that carried an identifier naming one device or person can be counted as a person: an id the exchange or our own tag sent, or a hashed advertising id from a phone that has not limited tracking. A fingerprint never counts, an opted-out device has no id, and an impression bought from a partner network is the partner's to count. Who we think you are, and when we refuse to guess explains those rules; this post picks up where they leave off, because many impressions — by design — carry no id at all.
The rest is estimated, from a frequency we measured
Impressions with no id used to be reported as delivery and left out of reach, which was honest and also useless: a campaign that reached many people on opted-out devices looked as if it had reached almost none. Since 9 October they are estimated, in four steps.
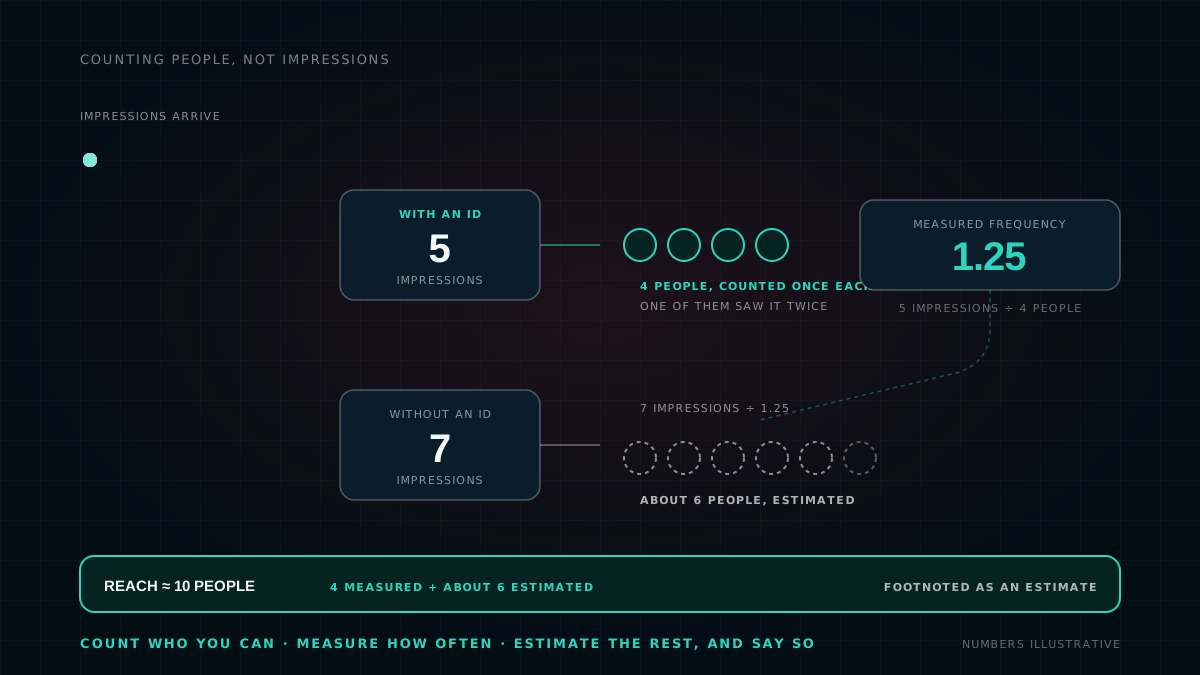
- Count the identified people once each, over the range and scope of the table — a campaign, a creative, a site.
- Measure the frequency on them: identified impressions divided by identified people. That is how often, on average, a person we could recognise actually saw the ad.
- Divide the unidentified impressions by that frequency. The result is how many additional people they most likely reached, if those readers saw the ad about as often as the ones we could count.
- Add the two, and say so. Reach is measured people plus estimated people; frequency is all impressions over that total; and the share of people who saw the ad once, twice, three times and so on keeps the proportions of the measured sample. Every figure that contains an estimate is marked.
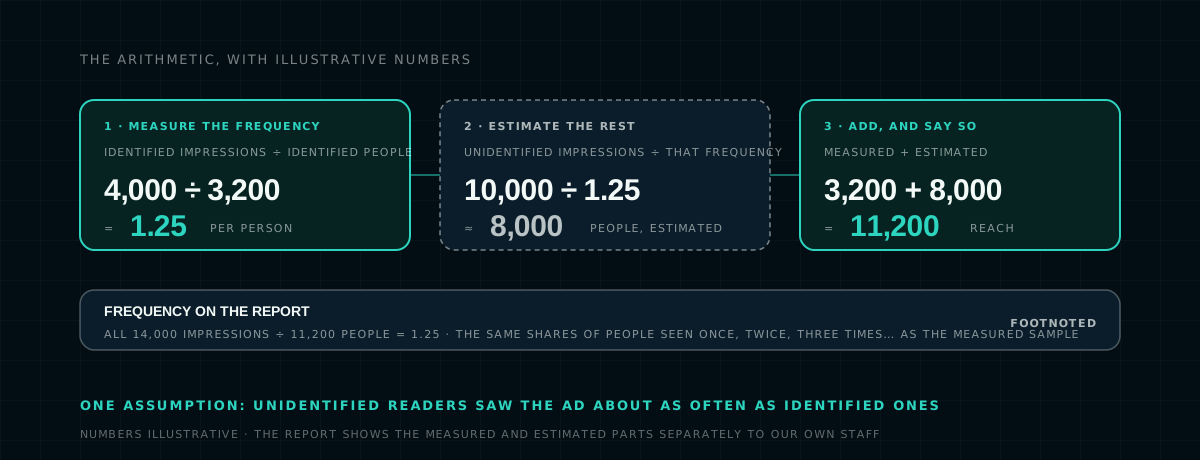
The arithmetic, with illustrative numbers. The whole method rests on one assumption, and the next section is about keeping it honest.
Where the frequency comes from
An estimate is only as good as the frequency it divides by, so the frequency has to come from a sample large enough to trust. We try four sources in order. First, the row's own identified sample — a day, a creative, a site — when it is large enough. If it is too small, the campaign's whole identified history, across all its days and not only the dates on screen. If the campaign itself is new or small, all the account's campaigns pooled, under the same minimum. And if none of those is large enough, no estimate is made: the cell shows a dash, and the impressions stay impressions.
The frequency is never derived from device data. No IP addresses, no browser strings, no fingerprints — only from people we could actually count.
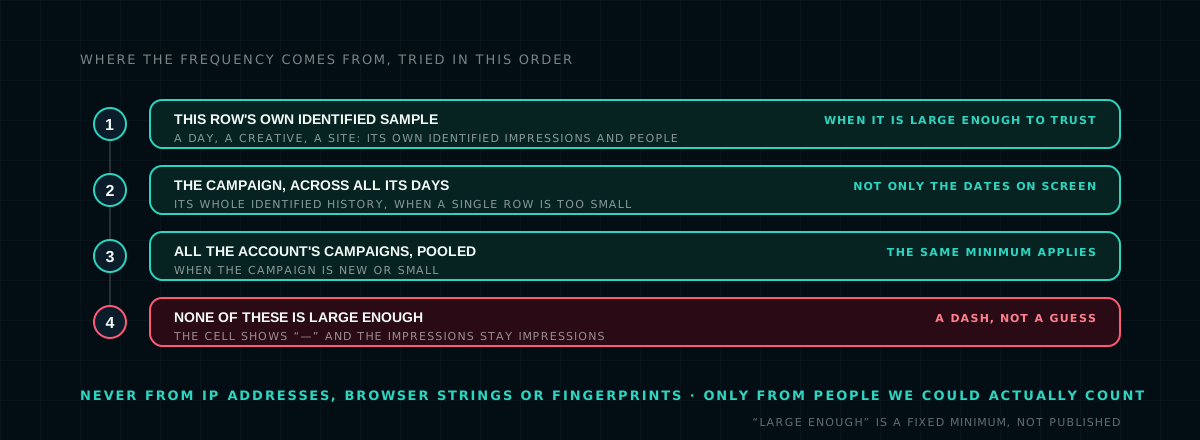
Where the frequency comes from, tried in this order. “Large enough” is a fixed minimum we do not publish.
How the report tells you which is which
- On screen, a figure that contains an estimate carries a tooltip saying so. Our own staff see the measured and estimated parts separately and can share the split with you.
- In files, a table that contains an estimate carries a footnote under it: Unique users include estimates where an impression could not be attributed to a person. A plain comma-separated export carries no footnote, because a line of prose breaks the tools that read those files, so ask for the spreadsheet or the PDF when you need the note.
- A dash means nothing could be counted and nothing could be estimated. It is never zero.
- A bound — a figure shown as “at most” — appears only in one rare case: when the range-wide count could not be run and the report fell back to adding days up. It is labelled as a bound, with the reason.
- No identifiers are shown to clients anywhere. A report of people reached lists people as rows, with their impressions and clicks, and never the id behind the row.
Partner networks count their own people
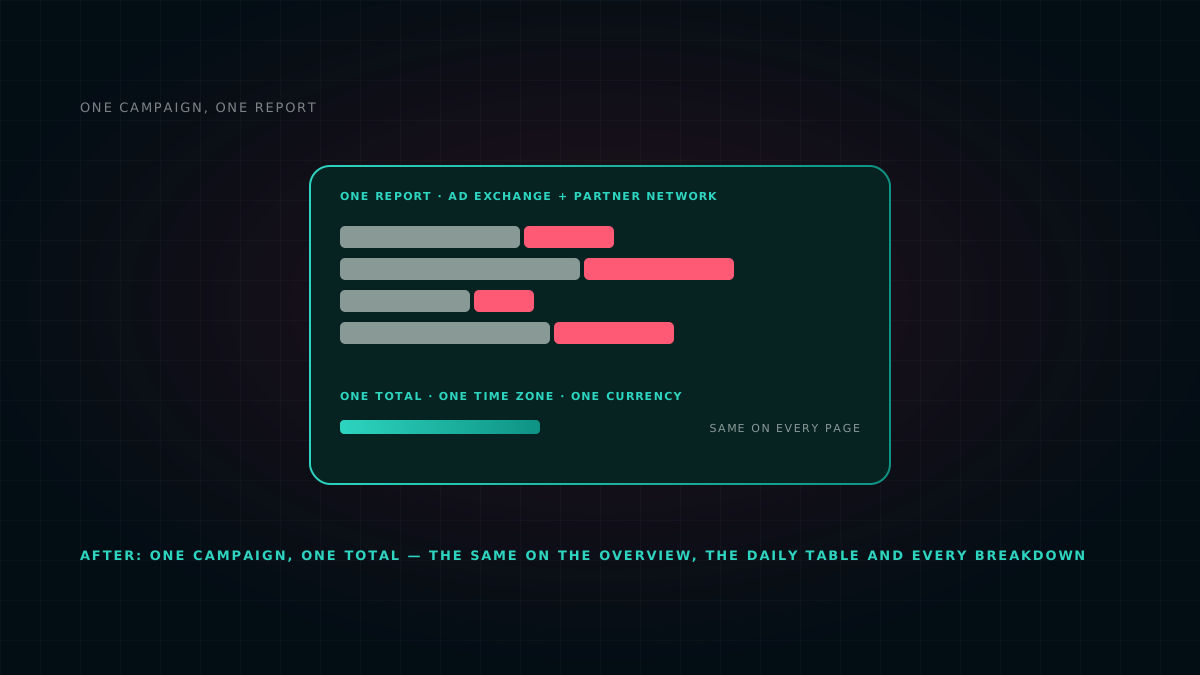
An impression bought on a partner network — video, search or social through your own account there — is reported by that network, and so is its reach. For each day the network reports, the report shows the network's own reach and frequency for that day, as a plain number. We never estimate on top of a partner's figure, and we never add a partner's daily people into a range total, for the same reason as above: a person seen on two days is one person, and only the network can count that. Where the network provides a flight-to-date figure, that is the one to read. One campaign, one report explains how partner delivery reaches the same report.
What each number means
| On the report | What it is |
|---|---|
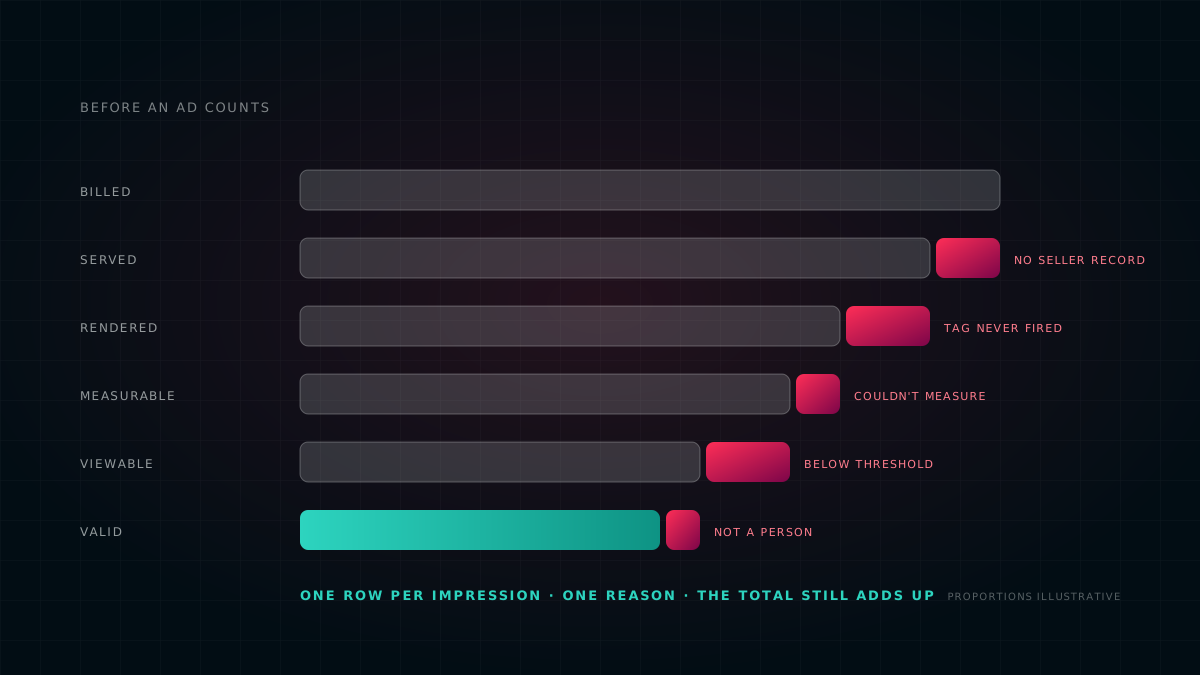
| Impressions | Ads served, every one of them, with or without an id — see the standard behind every impression |
| Unique users | People counted once across the range, plus people estimated from measured frequency; marked when an estimate is included |
| Avg. frequency | All impressions divided by unique users; the distribution keeps the measured sample's shares |
| “—” | Nothing could be counted and nothing could be estimated; never a zero |
| “At most” | A bound shown only when the range-wide count could not run; labelled with the reason |
| Partner reach | The network's own daily figure, never estimated, never summed across days by us |
What this is, and what it is not
This is our own method, not an industry standard, and it rests on one assumption: that readers we could not identify saw the ad about as often as the ones we could. Where that is wrong — a site where opted-out readers return far more often than others, say — the estimate is wrong with it. That is why the measured and estimated parts are kept apart, why the frequency comes only from samples large enough to trust, and why the report prefers a dash to a guess. It is also why we have published no figure for how much of our reach is estimated: we measure the share of impressions that arrive with each kind of id, and we will publish it once it has settled.
Count what you can count, measure what you can measure, estimate only from what you measured, and mark every estimate where the reader will see it. A reach figure that cannot be taken apart is a reach figure that cannot be trusted.
Ask how your reach was counted
Questions we get asked
Why did my reach figure change in October 2026?
Two changes landed on 9 October. Reach over a date range is now counted once across the whole range instead of adding up daily rows, which lowers it where the same people returned on several days. And impressions that carried no identifier are now estimated into people from measured frequency instead of being left out, which raises it. Either effect can dominate, so a figure may have moved in either direction.
How do I know how much of a reach figure is estimated?
On screen, a figure that contains an estimate carries a tooltip saying so. In exported files, a table that contains an estimate carries a footnote under it. Our own staff see the measured and estimated parts separately and can share the split with you on request.
Why does a partner network's reach not add up across days?
For a partner network we show the reach the network itself reports for each day, and we never estimate on top of it. Because a person seen on two days is one person, we do not add those daily figures into a range total, and the network's own flight-to-date figure is used where one exists.
Every number in the diagrams is illustrative. The minimum sample size behind “large enough” is a fixed setting we do not publish, and no figure for the share of reach that is estimated has been published yet; it will be, once measured. The behaviour described — the range-wide count, the four-step estimate, the tooltip, footnote, dash and bound — is how the reports work as of 13 October 2026 and may change. The partner-network figures are those networks' own; we do not alter them. This describes our own platform and is not advice for yours.