Most campaigns don't run in one place. A brand may buy programmatic inventory through ad exchanges while also running display through a partner network. Each source reports in its own dashboard, with its own definitions, its own time zone and its own currency. The result is familiar to every account team: two sets of numbers, a spreadsheet to reconcile them, and a client asking why the totals don't match. We built AdZoic's reporting to remove that step. Agencies and brands shouldn't have to reconcile two dashboards to know what a campaign delivered.
One total, everywhere you look
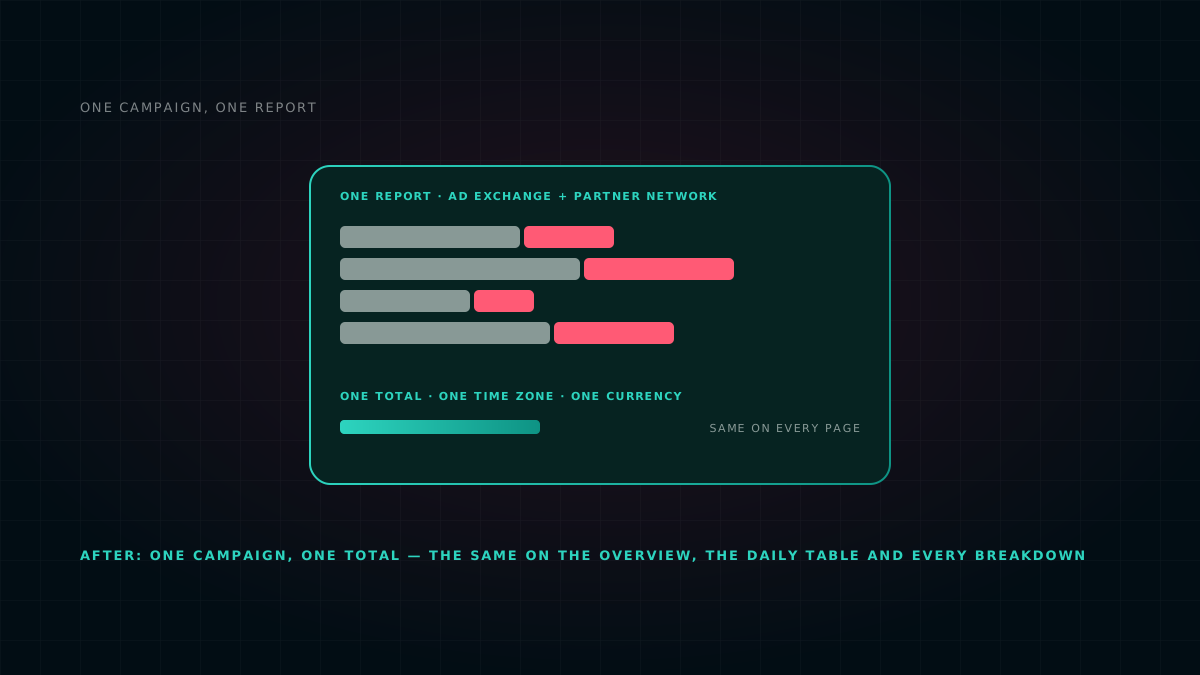
When a campaign runs across ad exchanges and partner networks, AdZoic merges the delivery into one set of reports. Impressions, clicks, viewability and cost appear as a single figure on the overview, the daily table and every breakdown — and they add up to the same total on each page. Clients see one campaign, not a list of suppliers.
Two details make that possible without fudging anything. Money is converted into one reporting currency using dated exchange rates, because each source bills in its own. And a source that doesn't report a particular metric contributes nothing to it, rather than dragging the merged figure towards zero — a partner that sends no viewability data does not make the campaign look less viewable than it was.
Fresh data, without manual exports
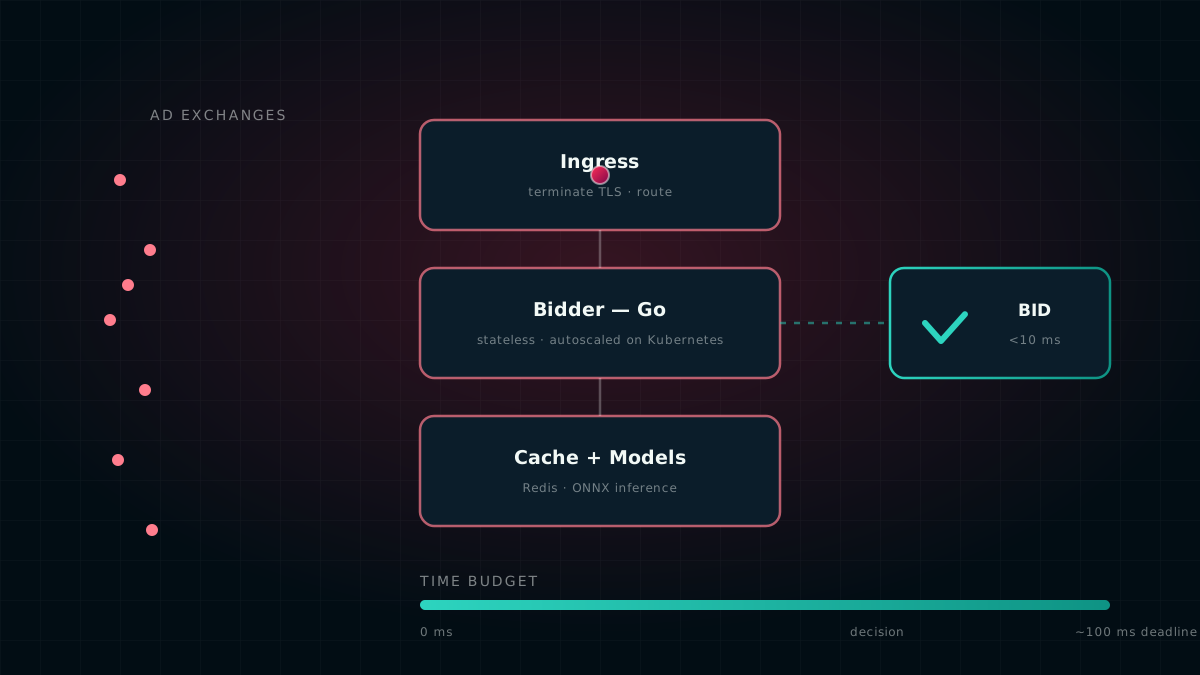
Where a partner network offers a reporting connection, its delivery is pulled in automatically every hour. Each pull re-reads the last few days rather than just appending the newest, because partners restate recent figures, and a report that only ever adds would drift away from the partner's own. The detailed list of apps and websites a partner ran on is refreshed every day. Delivery from the ad exchanges, where our own bidder does the buying, refreshes every fifteen minutes.
For a connected partner there are no spreadsheet exports to chase and no end-of-week uploads. A partner that can only provide files still lands in the same report through an import path, so the client's view doesn't change with the plumbing behind it.
Transparency down to the placement
Clients can see the apps and websites their ads appeared on, with impressions, clicks, viewability and cost for each one. The list shows the largest placements by name and groups everything smaller into one explicit remainder line — “and N more” — so the chart's total stays exact. Nothing is silently truncated to make a tidy top ten.
On one recent campaign, a brand launching in a new market could see, on day one, that more than 200,000 impressions had run across more than 3,000 apps and websites. The large majority were attributed to a named placement, and the rest was shown openly as a single grouped line rather than hidden.
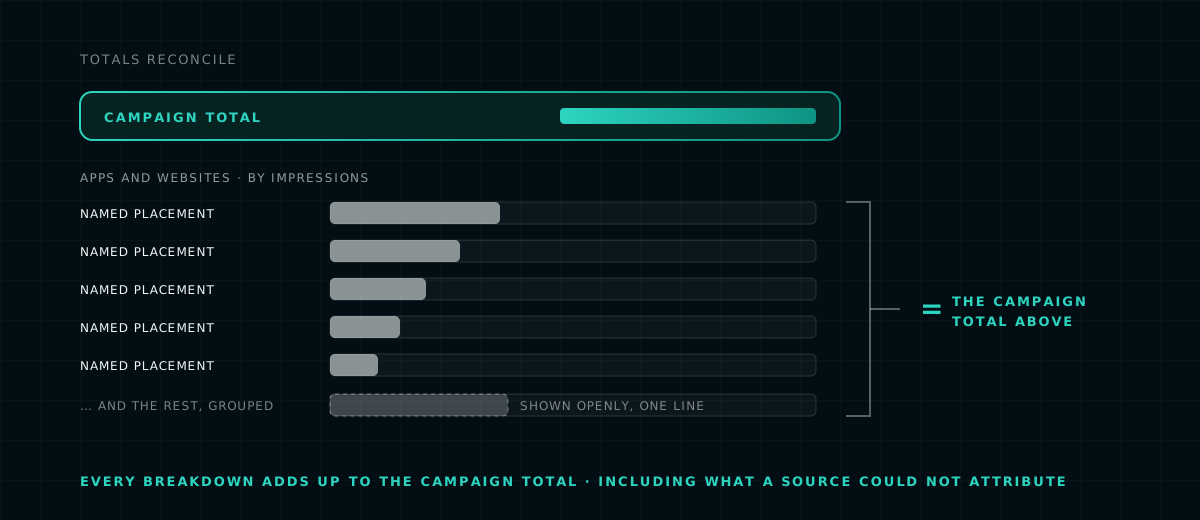
The breakdown rule: name what you can, group what you can't, and make the rows add up to the total shown at the top of the page.
Metrics you can defend
Reporting is only useful if it holds up when a client asks a hard question. A few principles guide how AdZoic counts:
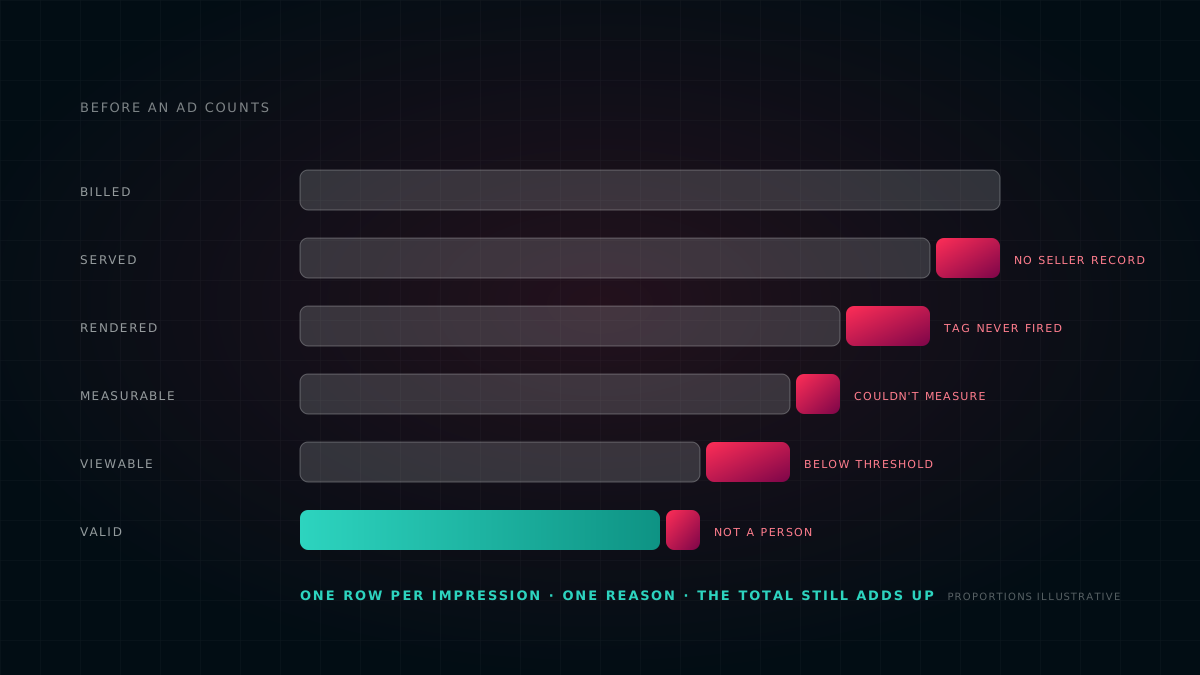
- Viewability follows the industry convention: viewable impressions divided by measurable impressions. Across sources it is summed and then divided, never averaged — an average of two rates gives a small partner the same weight as a large exchange. What has to be true before an impression counts explains the standard behind it.
- Reach counts real users only. Impressions that arrive without a user identifier are reported as delivery, but never counted as extra “people” in reach. And because a person who saw the campaign on two days is one person, not two, wherever reach has to be combined across days or placements the report labels the figure as an upper bound rather than presenting it as exact.
- Days follow one clock. Every source has its own idea of “today”. The report keeps one reporting day and files partner delivery into it hour by hour, so the client and the report mean the same thing by “yesterday”. Where a partner reports only whole days and its clock doesn't line up with ours, the figure is marked approximate rather than quietly moved.
- Totals reconcile. Every breakdown table adds up to the campaign total, including what a source couldn't attribute. If the rows don't add up, the report is wrong, not the world.
Built for agencies
Agencies can run AdZoic under their own brand — their name, logo and colours, on their own domain once they have proved they own it — with their own logins for their teams and for their clients. Each user sees what their role needs. Client teams see delivery and the price they pay. Internal teams see the operational detail behind it, including the split by source, which is never shown to a client role: the client bought a campaign, not a list of suppliers.
What this means for you
- For agencies: less time reconciling, and faster answers when a client asks what they bought.
- For brands: one clear view of the whole campaign, wherever it ran — with numbers that hold up when someone asks how they were counted.
A report that needs a spreadsheet beside it isn't finished. The work of merging sources, lining up clocks and currencies, and making the rows add up belongs in the platform — not in an account manager's Friday afternoon.
The figures quoted are from a single campaign, rounded, and illustrative; results vary by market, inventory and campaign setup. We don't publish the names of our supply partners or of the brand concerned, and no client data appears here. This describes how our own platform counts, as it works today.